Technical Outlook for Majors 21/06/2016
 EURUSD
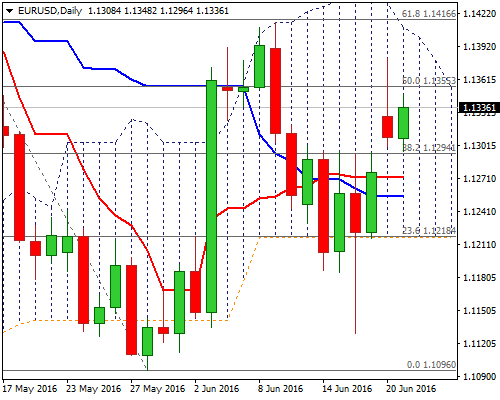
Yesterday’s rally stalled at 1.1381, with subsequent weakness ending day in red. Daily candle with long upper shadow signaled rising selling pressure ahead of strong resistances at 1.1409/16 (daily cloud top / Fibo 61.8% of 1.1614/1.1096 descend).
Psychological 1.1300 support so far holds dips, despite being cracked overnight and marks the upper side of pivotal 1.1300/1.1285 support zone.
Daily studies are bullishly aligned, however, downside risk is expected to persist while the price remains capped under daily Ichimoku cloud top.
Stronger bearish acceleration could be anticipated on slide below 1.1300/1.1285 zone, towards 1.1271/55 (sideways-moving daily Tenkan-sen / Kijun-sen lines) and key support at 1.1217 (daily cloud base.
Daily Slow Stochastic is approaching overbought territory and would generate bearish signal on reversal lower.
Only sustained break above 1.1409/16 breakpoint zone would neutralize downside threats and open way towards next barriers at 1.1445 and 1.1500.
Res: 1.1355; 1.1381; 1.1409; 1.1416
Sup: 1.1296; 1.1285; 1.1255; 1.1217
 GBPUSD
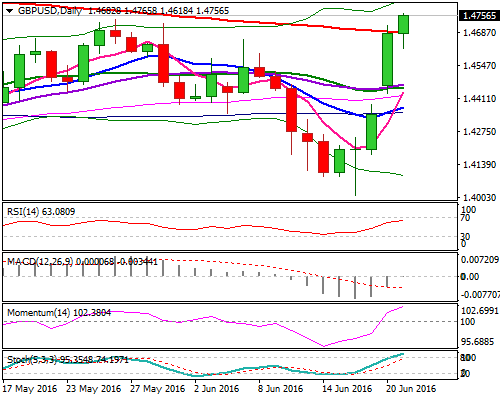
Cable has cracked 1.4737 barrier, the first of two tops (posted on 26 and 03 May), which mark strong resistance zone, on extension of strong three-day rally.
Yesterday’s long bullish candle, which was left after week’s gap-higher opening and subsequent bullish acceleration, generated strong bullish signal for final attempt through 1.4737/68 breakpoint zone.
Daily MA’s are now in full bullish setup, after 200SMA was broken, supporting further upside action.
Final break above 1.4768 hurdle would open way towards next hurdle at 1.4881 (50% of 1.5928/1.3834 descend) and psychological 1.5000 barrier, seen in extension.
Overbought Slow Stochastic suggests corrective action in the near-term, however, no bearish signal being generated so far.
Broken 200SMA marks good support at 1.4689, ahead of session low at 1.4618.
Res: 1.4768; 1.4800; 1.4881; 1.5000
Sup: 1.4737; 1.4716; 1.4689; 1.4618
 USDJPY
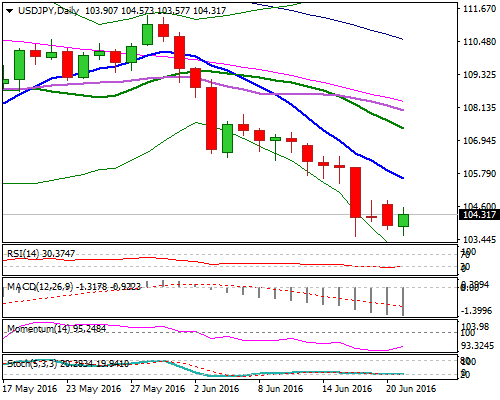
The pair retested last Thursday’s new 2016 low on overnight’s fresh weakness. Monday’s trading ended in red, after recovery action stalled at 104.82, confirming persisting downside pressure.
Long bearish candle of last week weighs, with daily technicals being in firm bearish mode.
Final break through 103.50 breakpoint could be delayed for prolonged consolidation, as daily RSI / Slow Stochastic are oversold. However, limited upside action is seen for now, with yesterday’s high at 104.82, marking solid resistance, ahead of 105.20 (Fibo 38.2% of 107.89/103.54 downleg) and former low at 105.53 (03 May low, reinforced by falling 10SMA), break of which would sideline immediate downside threats.
Res: 104.57; 104.81; 105.20; 105.53
Sup: 104.10; 103.75; 103.54; 103.00
 AUDUSD
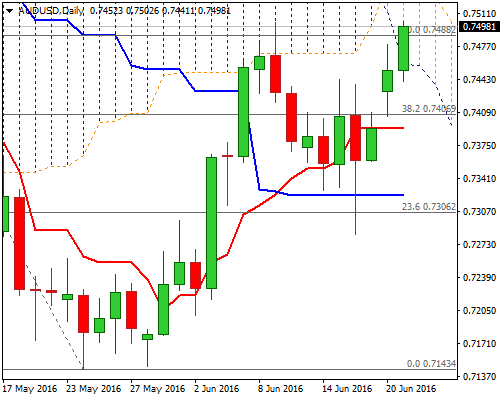
Aussie dollar maintains positive near-term tone and cracks key 0.7502 barrier (09 June high) on fresh extension of three-day recovery action from 0.7283, where higher low was left.
Bullish setup of daily studies supports further upside action, with break above 0.7502 barrier, needed to generate fresh bullish signal for extension towards next strong resistances at 0.7538 (daily Ichimoku cloud top); 0.7569 (Fibo 61.8% of larger 0.7833/0.7143 descend) and 0.7599 (weekly cloud top), in extension.
Broken daily cloud base offers immediate support at 0.7458, followed by session low at 0.7441and yesterday’s low at 0.7405 (also broken Fibo 38.2% of 0.7833/0.7143, reinforced by sideways-moving daily Tenkan-sen line), which is expected to contain extended corrective actions.
Res: 0.7502; 0.7538; 0.7569; 0.7599
Sup: 0.7458; 0.7441; 0.7405; 0.7393, Daily Market Outlook